Tracking down performance bugs in Sidekiq jobs
2017-06-05
The Problem
A Sidekiq Enterprise customer recently emailed me to ask for help.
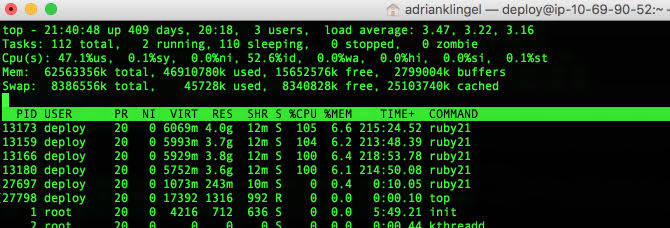
I’m having trouble trying to figure out why one particular worker I have takes so long per job. Some of the jobs are taking 30 minutes. What the program does is load a spreadsheet to the database. When I run “top”, it looks like this. What should my next step be?
The Explanation
Great question. The top screenshot tells me a few things:
- Each process is using ~4GB of RAM, which is a lot, but top also notes the machine has ~64GB of memory so it’s not necessarily unusual.
- There are four Ruby 2.1 processes (which I assume are Sidekiq processes), each pegging a core at 100%. We want to track down what is causing the CPU to peg.
There’s a two step process to get more info:
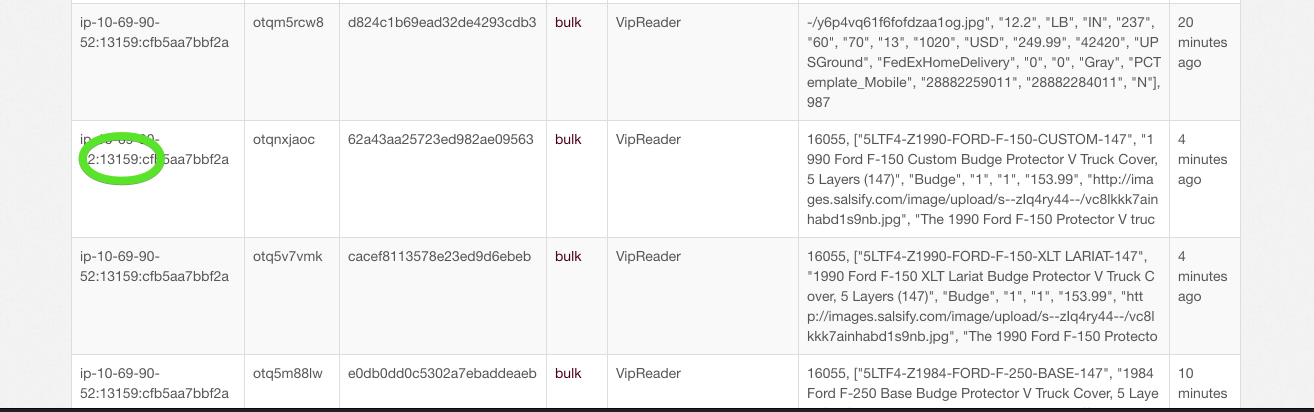
- Visit the Busy page in the Web UI and see which jobs are running right now. See a job that’s taking too long? Note its PID and TID (“13159” and “otqnxjaoc” in the screenshot).
- Send the TTIN signal to that PID (
kill -TTIN 13159) and find the backtrace associated with that TID in the log output.
Often the job backtrace will give you the clue you need to solve the performance problem.
The Conclusion
In this case, the backtrace did provide the necessary clue and the customer did find a solution. He was creating a job per row in an Excel file but each job had to get the header data from the Excel file; if there was 1000 rows, he’d create 1000 jobs and each job would reparse the entire Excel file to get the header info. By restructing the job arguments to include the header info, he removed this redundant work and solved a problem which had plagued him for months. Time elapsed: less than an hour!
Moral of the story: harness the awesome power of Sidekiq’s TTIN feature to crush your performance bugs!